
| References: https://en.wikipedia.org/wiki/Peter_Roizen https://en.wikipedia.org/wiki/T/Maker |
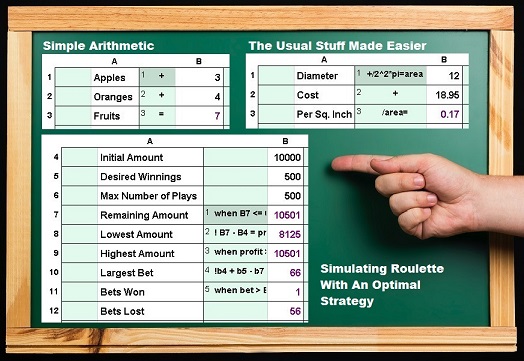
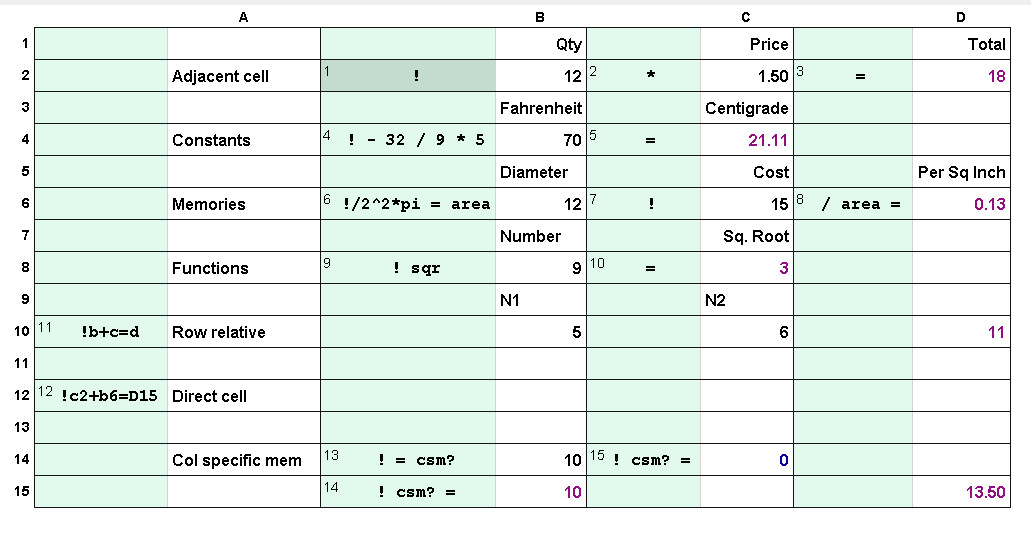
I find algebraic formulae: tedious, mistake prone, too much typing, and a constant reminder of Bingo.  |
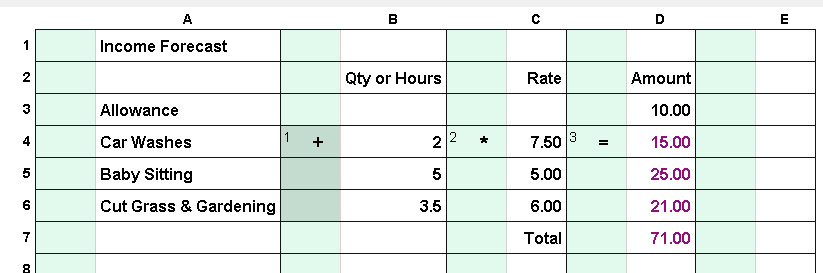
I
find calculation trails in separate cells: intuitive, quick,
and fun! 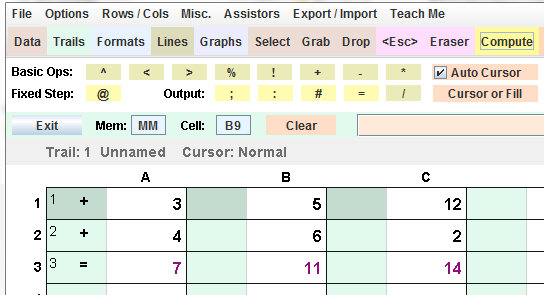
|
| Links for later: The Download Page Tutorial Videos Example Tables |
 |
 |
 |
 |
 |
 |
| Links: The Download Page Tutorial Videos Example Tables |